
Google Analytics For The Events Industry: An Honest Guide
As a former event marketer, I can’t say I miss grappling with attribution, multi-channel conversion tracking, and ecommerce reports.
Event marketing is hard! Part of this is down to digital marketing being challenging generally, but much of it is due to the nature of conferences and events specifically. In this post I’m going to lay out:
- The reasons it’s nearly impossible to measure everything you want to measure.
- A step-by-step guide to integrating Tito and Google Analytics.
- Some of the insights you can draw from the data.
If you’re not a Tito customer, there’s still lots to be gained from this article. I’d just suggest you skip Part 2 for now. I’ve peppered some “Organiser Pro Tips” throughout the post for added takeaways. ?
Part 1: Why Event Marketing Is So Hard
Whenever I speak to fellow event organisers, especially those who are heavily involved in marketing their events, the conversation always gets round to the same topic: how difficult it is to work out which of our marketing efforts are paying off.
Even the most diligent application of UTM codes, and the classic “how did you find out about us?” question on the sign-up form, can yield precious few clues. It’s frustrating, but it’s also par for the course, because the events industry just doesn’t work like a lot of other industries.
High Price Point
The average price of a paid ticket in Tito over the last six months is 691 EUR (about 808 USD). If you were an FMCG multinational, or a fashion retailer selling a cheap slogan t-shirt, you’d be able to run paid ads and see direct purchases as a result. But people don’t tend to impulse buy conference tickets in the same way, as they’re much more expensive.
![]()
So while you may still choose to run paid ads as part of your awareness-building campaign, you probably won’t see instant results. You’ll need to work harder to track ROI, and it’ll likely come in the form of assisted conversions, which we’ll look at later in this article.
Organiser Pro Tip: Remarketing ads can yield instant results. The ads display to people who’ve visited your site before, and you can be specific in your segmentation, for instance “people who visited the tickets page but didn’t complete a purchase”. You can even add dynamic elements like a countdown to a deadline, such as a price increase.
Long Lead-In Time
Many conference organisers open ticket sales six months or more before the event. You may experience an early spike in sales just after launch as keen repeat attendees snap up their tickets, and possibly another spike as early bird pricing is about to end. But then the next few months can seem excruciatingly slow.
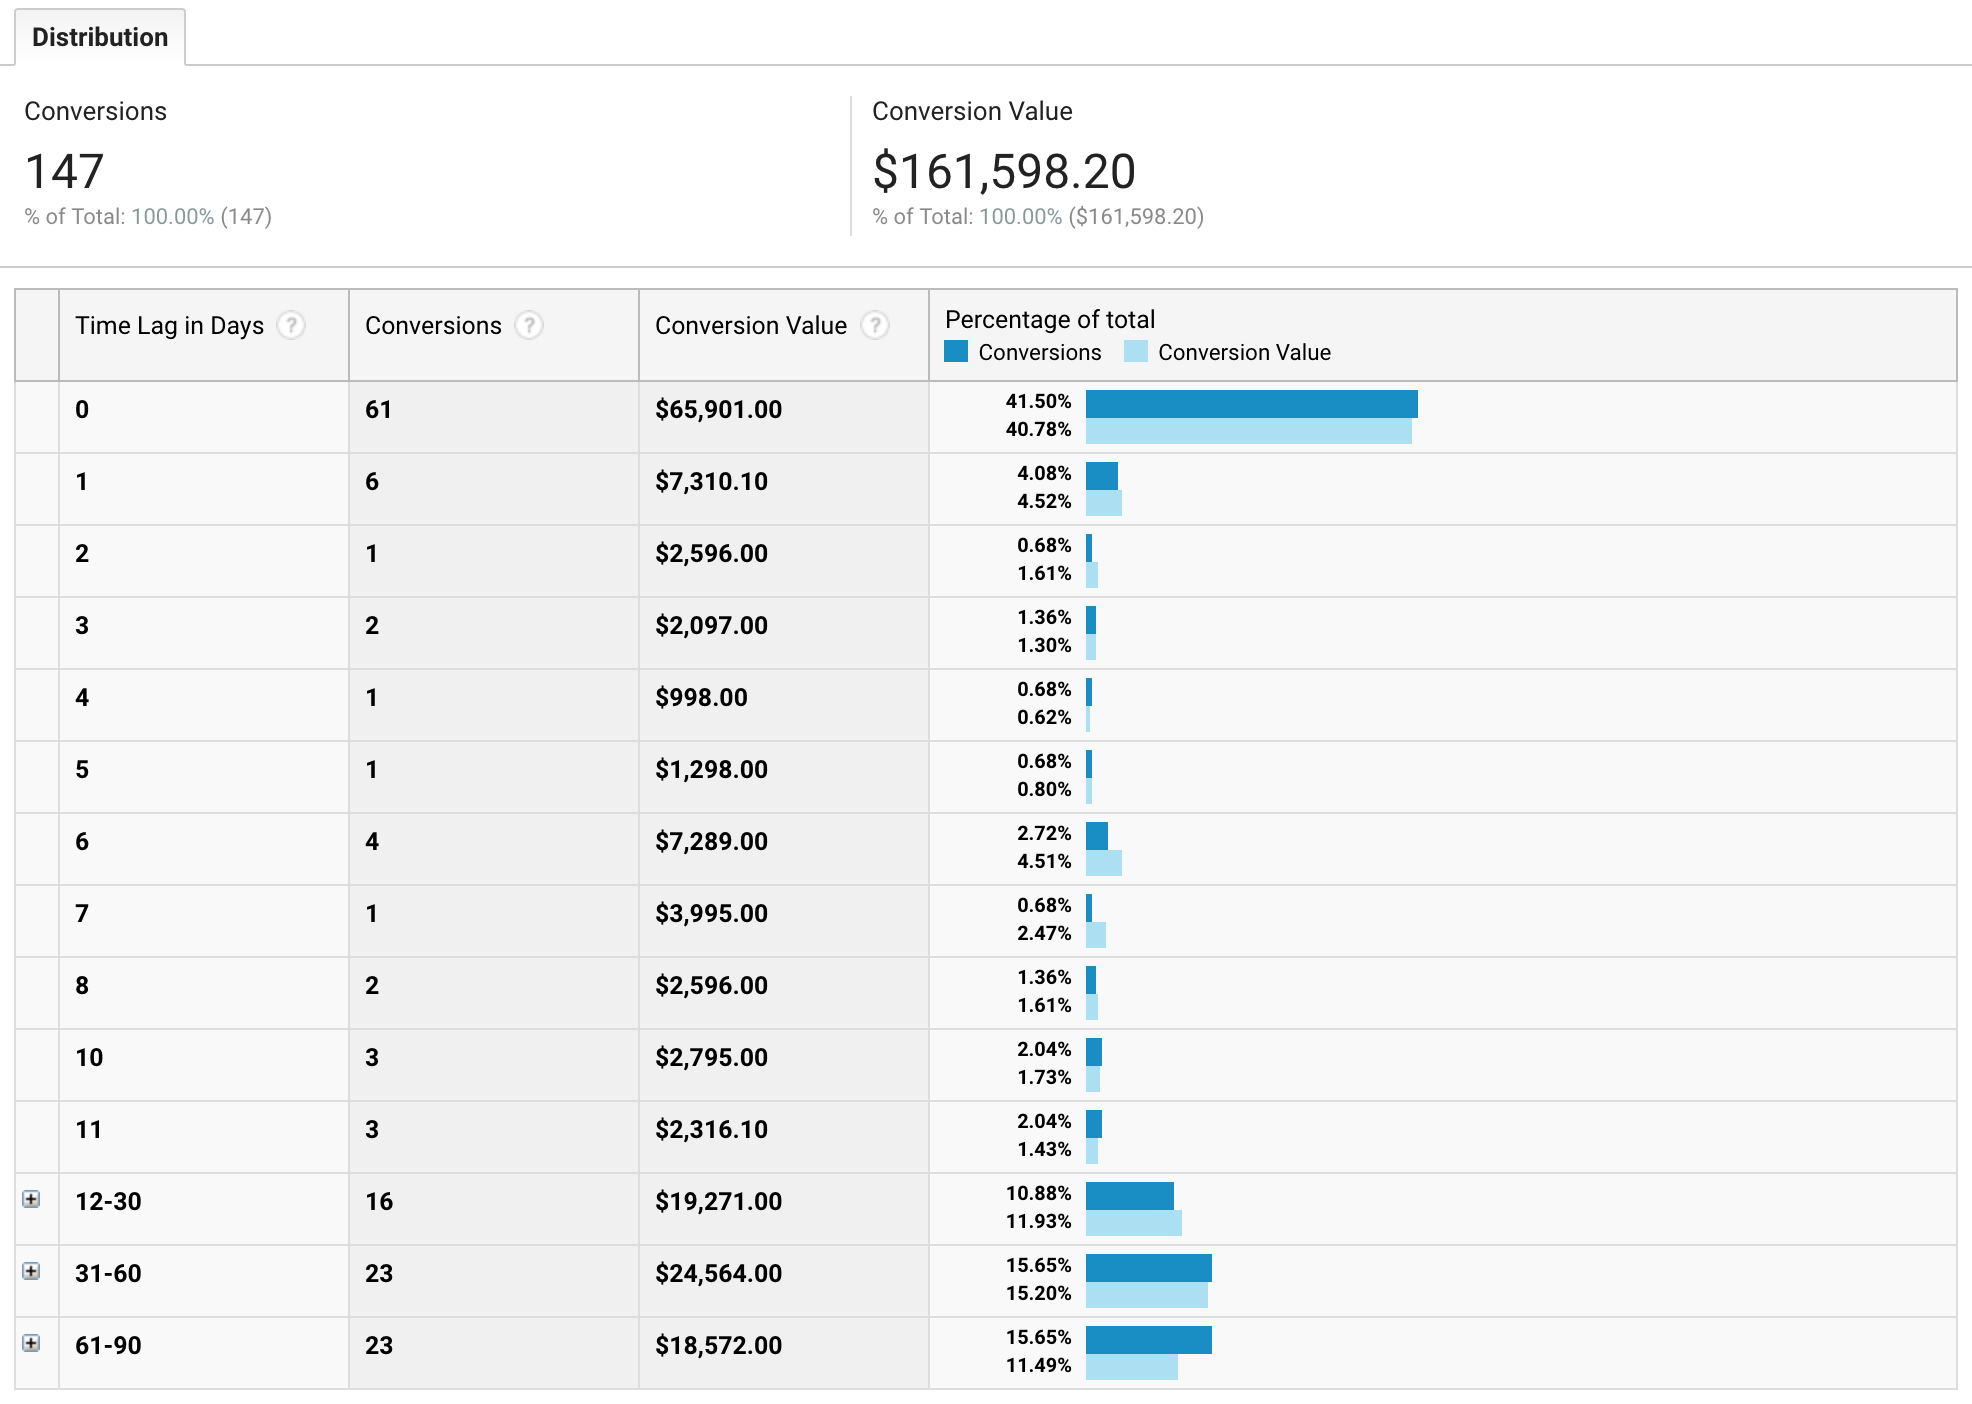
This screenshot from a real customer account (shared with permission) shows that more than a third of conversions happen between 12-90 days after the person first landed on your site. In fact some may take even longer, but Google Analytics counts 90 days as the maximum conversion window—one of its limitations, which we’ll look at in more detail later.
This long lead in time means a high percentage of bookers don’t register straight away. They return to the site many times over a period of weeks before finally purchasing their ticket. Reasons for this delay include checking availability, waiting to see the full line-up, getting budgetary sign-off, and general procrastination.
Booker ≠ Attendee
You might have read the previous paragraph, looked at the picture and thought, “yeah, but almost half of those conversions happen on the first day! Are those people just quick decision makers?”
Some of them might be, but a lot of them will be people booking on behalf of other people. This makes life hard for marketers. Let’s look at a fictitious but realistic example of three people from the same organisation interacting with your conference website:
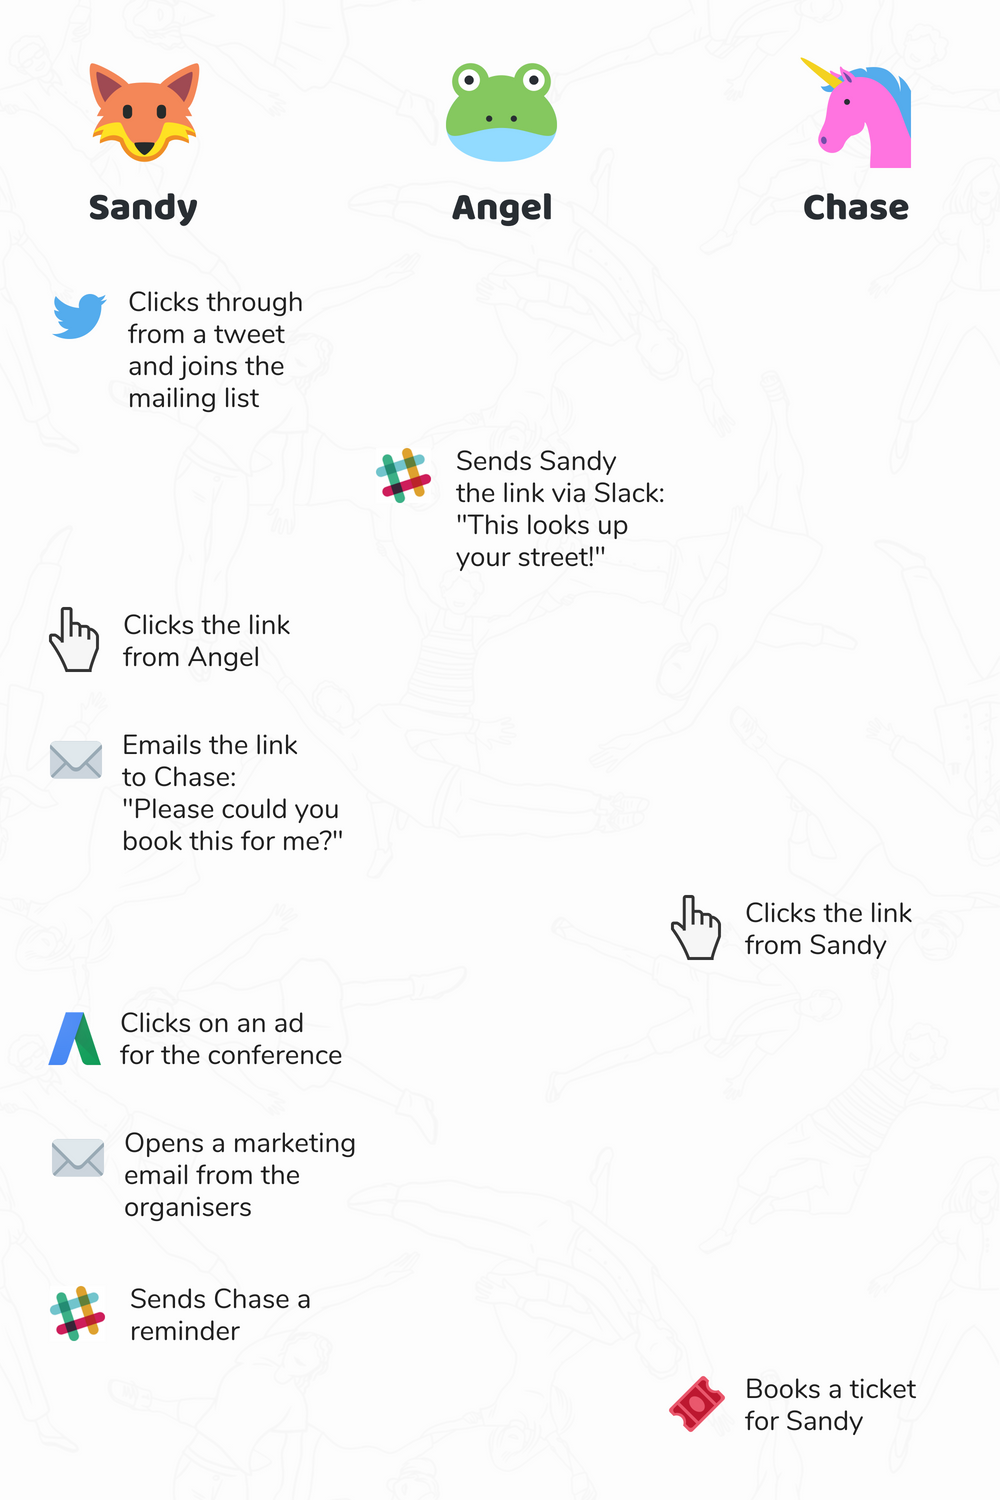
Sandy is the person who’ll ultimately attend your conference, and originally found out about the event on Twitter. But they also clicked on an ad and a marketing email, as well as a direct link from Angel. So these marketing efforts contributed to the decision-making process. But as Chase is the person who placed the order, only their visit will show as resulting in a transaction, and it’ll be attributed to “direct”—the rest of the journey that led to the sale isn’t captured at all.
Know The Limitations
As the example above shows, your paid ads and other marketing efforts may be playing a bigger part than the stats suggest. Typically there are several touchpoints with each customer, and you have different attribution models to choose from depending on how much importance you place on each interaction.
Is the first touch the most relevant because that’s how they (probably) discovered you? Or is the last touch more significant because that’s the one that (possibly) converted them? Or do you want to give all touchpoints even weighting, because they all contribute to awareness raising? Are any of them even that useful given what we’ve seen about how people tend to book tickets?
Analytics tools can provide interesting insights but will never tell you the full story because of a few inherent limitations:
- Each device is treated as a unique visitor, so the system can’t differentiate between multiple people using the same device and it can’t recognise when the same person is using several different devices.
- Lots of factors can prevent Google Analytics from working. If people opt out of allowing cookies, or disable JavaScript, or use ad blockers, these can all interfere with tracking.
- Analytics tools just generally might not be that reliable.
So why am I even suggesting you integrate Tito and Google Analytics at all?!
Well, even with all that said, you may still want to use Google Analytics to track (as much as you can) where people who click through to your Tito event homepage from your website have come from originally, so you can get a sense which of your marketing efforts are most effective.
And the good news is it’s really easy! Here’s how to do it:
Part 2: Connecting Google Analytics to Tito
It’s very straightforward to make Google Analytics play nicely with Tito. You don’t need to be able to code, but you will need access to your event website’s codebase. Our documentation goes into the specifics, but here’s a super simple checklist containing just four easy steps (and an optional fifth one):
1. Contact Us
Our Google Analytics functionality hasn’t been released for all our customers yet, so if you’d like to use it you first need to drop us an email at support@tito.io and we’ll enable it on your account.
2. Prepare Google Analytics
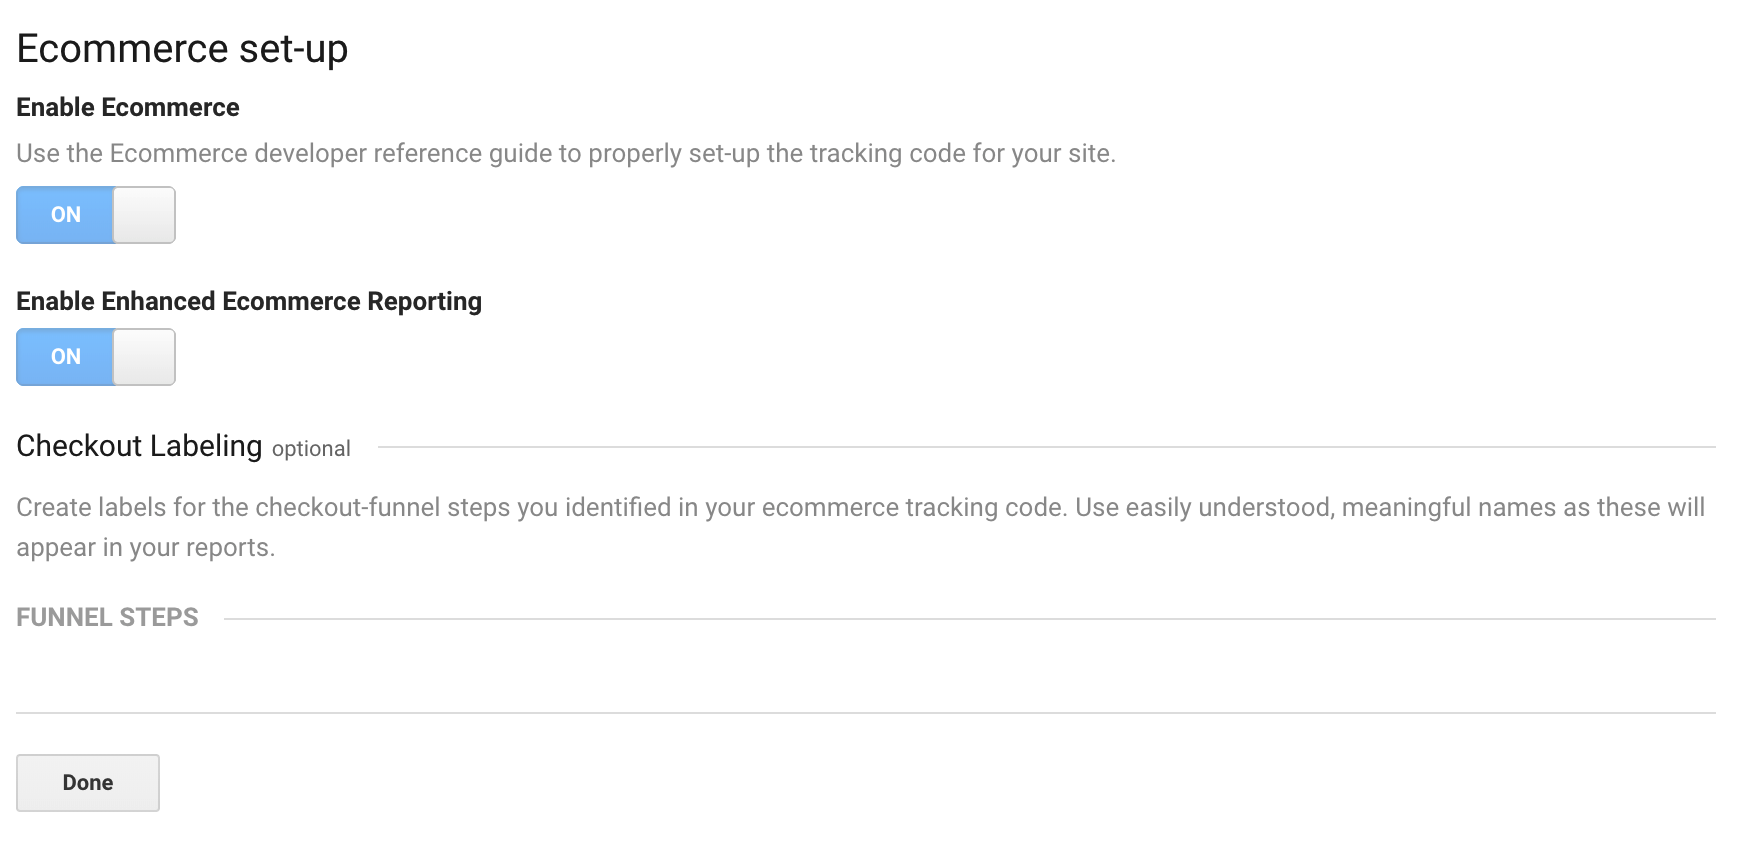
If you don’t already have a Google Analytics account you’ll need to set one up and connect it to your website. Then enable Ecommerce tracking in Google Analytics, ensuring both Ecommerce and Enhanced Ecommerce settings are switched on.
3. Update Your Website
You need to enable the linker plugin on your event website, so that Tito can receive data from your website and pass information back to it. Simply replace the Google Analytics code on your event website site with the snippet here, making sure to overwrite the placeholder UA number with the correct one from your GA account and XYZ.com with your website URL.
4. Add Your Tracking ID to Tito
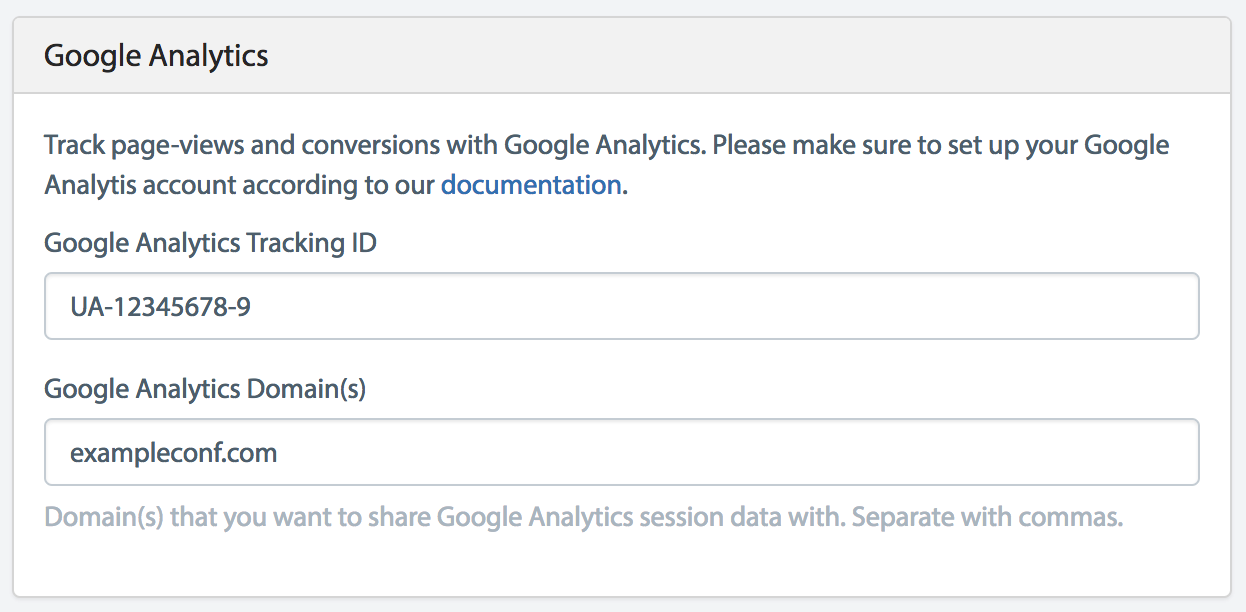
Head to Customize > Services in Tito and add your Google Analytics tracking ID (if you don’t see the option, contact us and we can enable it for you).
5. Set A Custom Close Link (Optional)
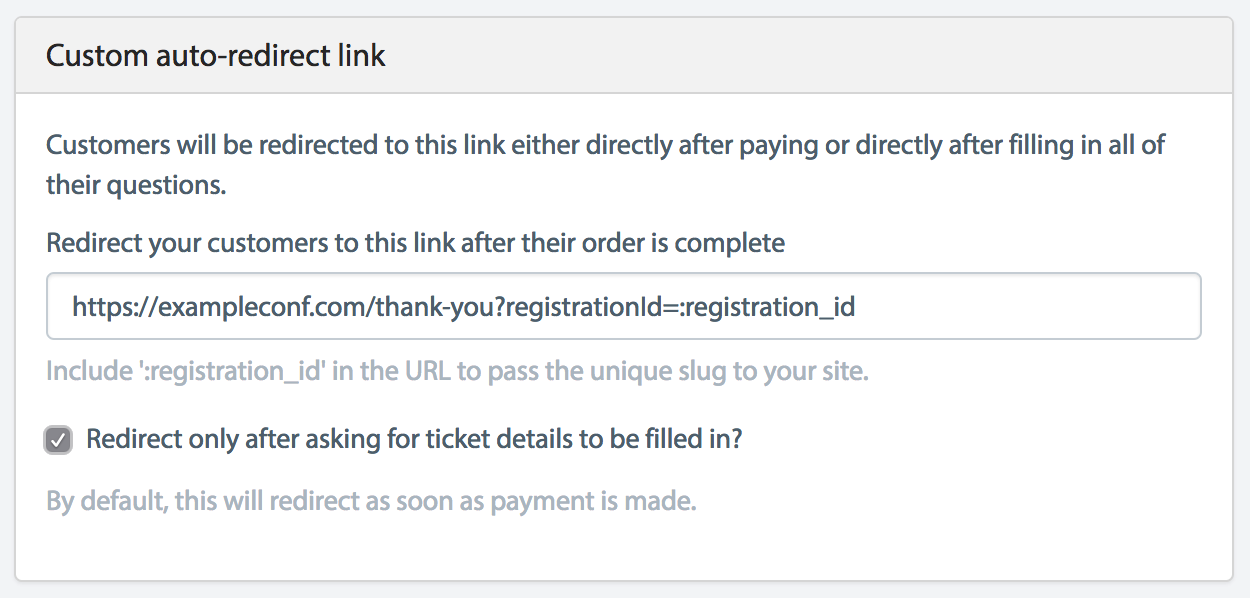
If you wish, you can set a custom link that your customers will be redirected to after they’ve completed their purchase. This is another beta feature, so contact us for access, and once we’ve enabled it you’ll be able to set a custom link under Customize > Services:
Organiser Pro Tips:
- Make sure the checkbox is ticked, so that attendees will be asked to complete your custom questions before they’re redirected.
- Rather than redirecting back to your event website homepage, create a custom page on your website, e.g. /thank-you, and use this as your redirect link. It’ll help reassure customers that their booking has been successful.
- If possible, set your success page to be hidden from search engines—you’ll need to do this in your CMS rather than in Tito.
- Your success page could say something like “Thanks for registering! You’ll receive a confirmation email containing your ticket. Contact us at help@exampleconf.com if you have any questions.” and could include links to next steps—e.g. accommodation options or social sharing.
- You don’t need to set up goals in Google Analytics to pull in conversion data, but you can do so if you want to track something specific. The custom auto-direct is a good one to use if you’re experimenting with goals.
- If you’d like to track individual registrations in Google Analytics, append registrationId=:registration_id to your URL.
What If You’re Using The Widget?
If you didn’t already know, Tito offers an embeddable widget. With just a few lines of code, you can display tickets on your website rather than sending customers to the Tito event homepage. You can even style it to look like a native part of your website:
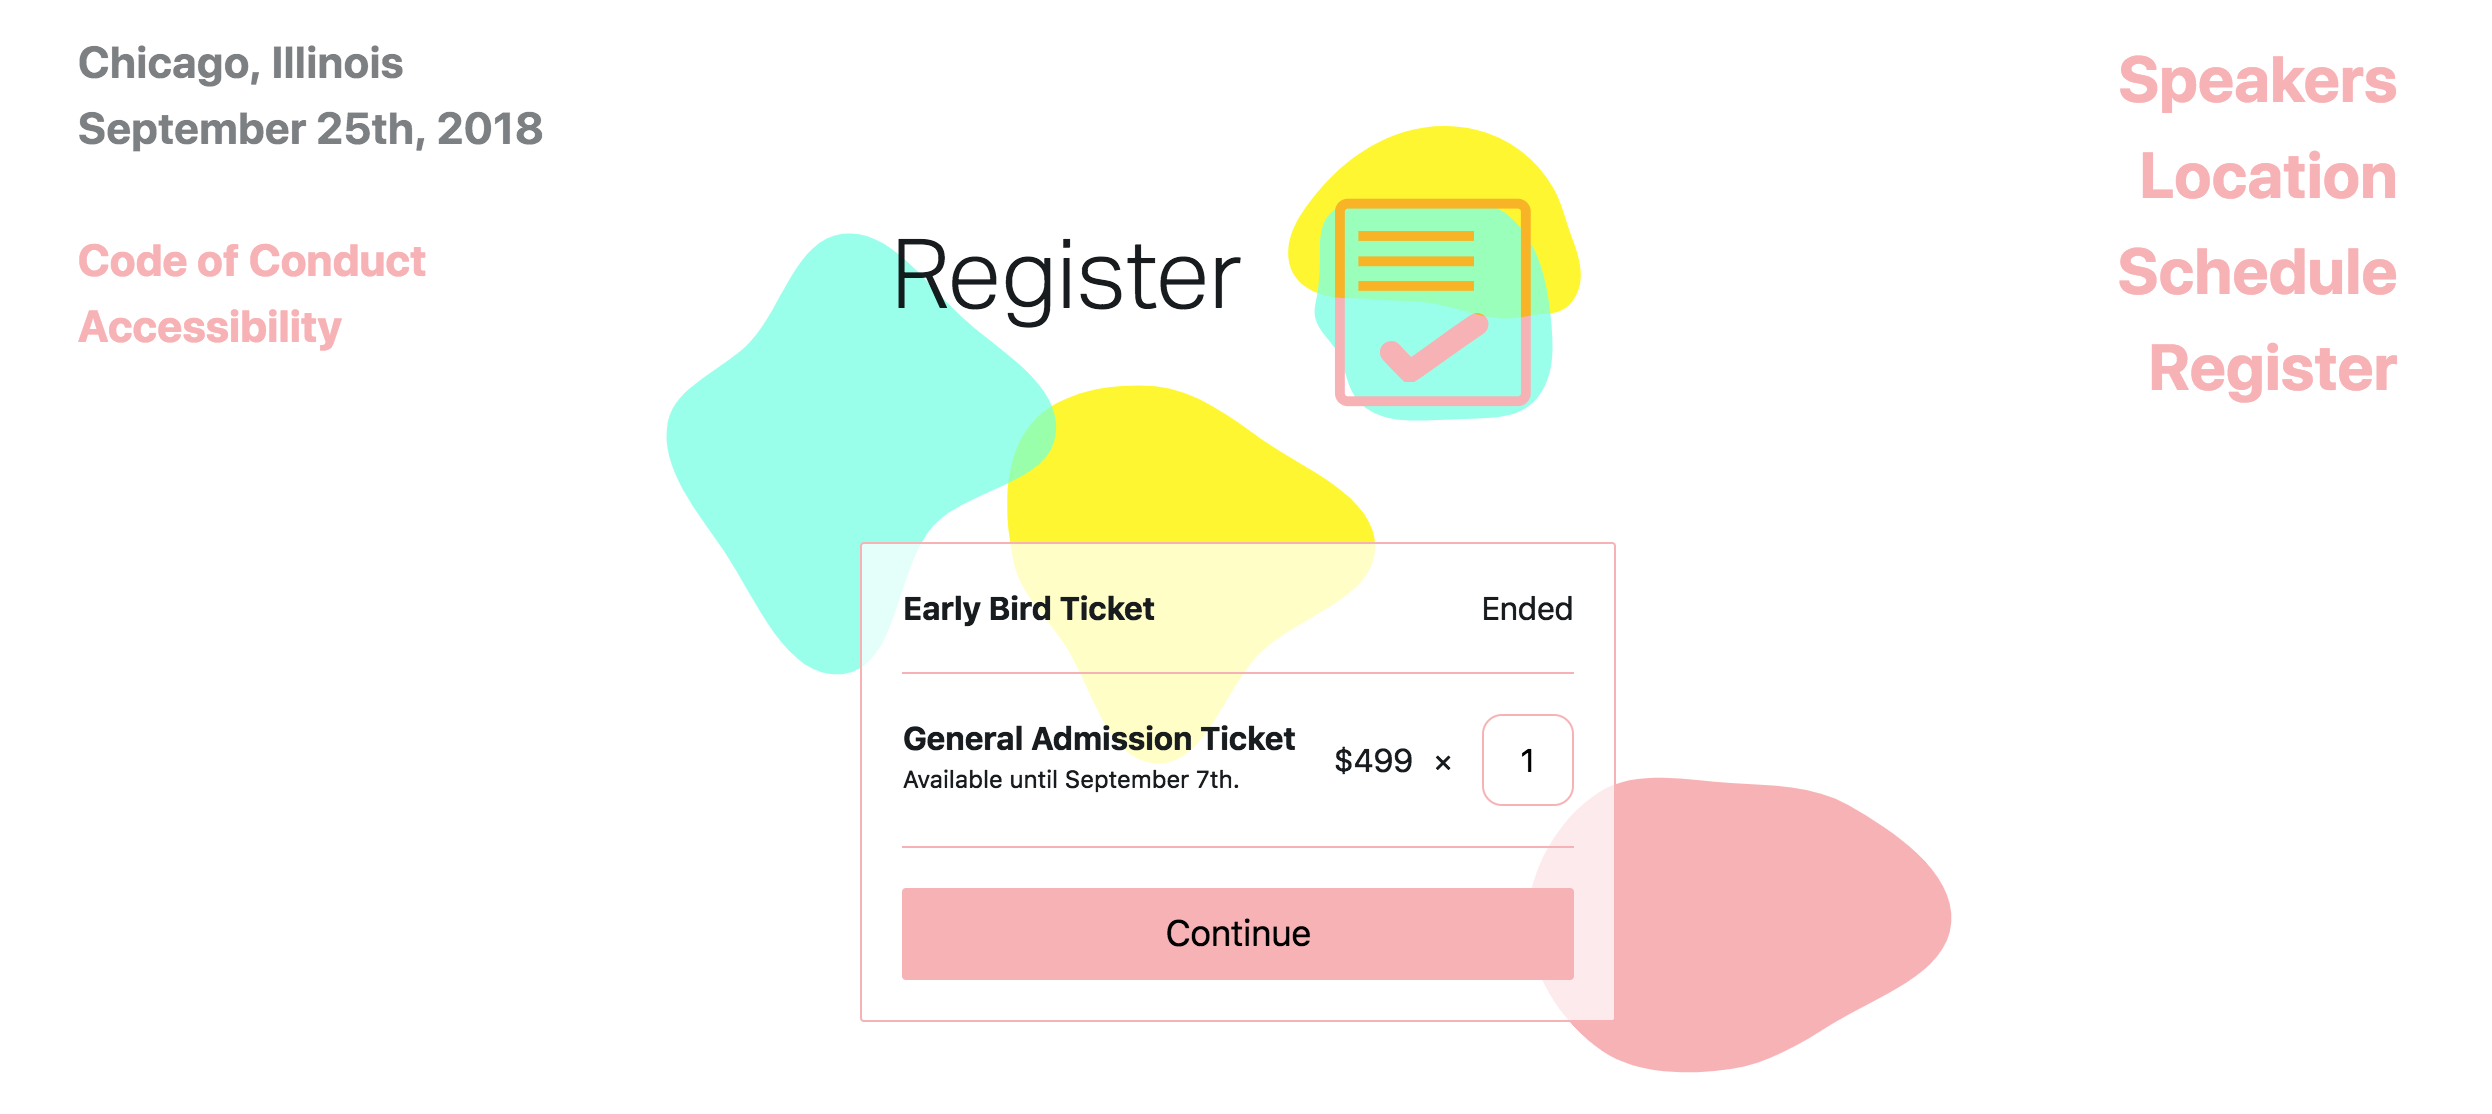
If you’re using the widget, your Google Analytics integration will need to be set up in a slightly different way as the widget is an embedded iframe. Our documentation has all the information you’ll need.
Part 3: Interpreting Data in Google Analytics
Now you’ve set up the integration, you should start to see data in Google Analytics as purchases are made, with conversion values against your different campaigns and sources.
As I mentioned in Part 1, you should be wary of treating any data in Google Analytics as gospel, but I do want to run through a few cool examples of the types of reports you can run.
Ecommerce Overview
Conversions > Ecommerce > Overview
Google Analytics’ ecommerce reports allow you to analyse purchase activity. Here’s what three months of activity looks like for a conference using the Tito integration to pull in transaction data.
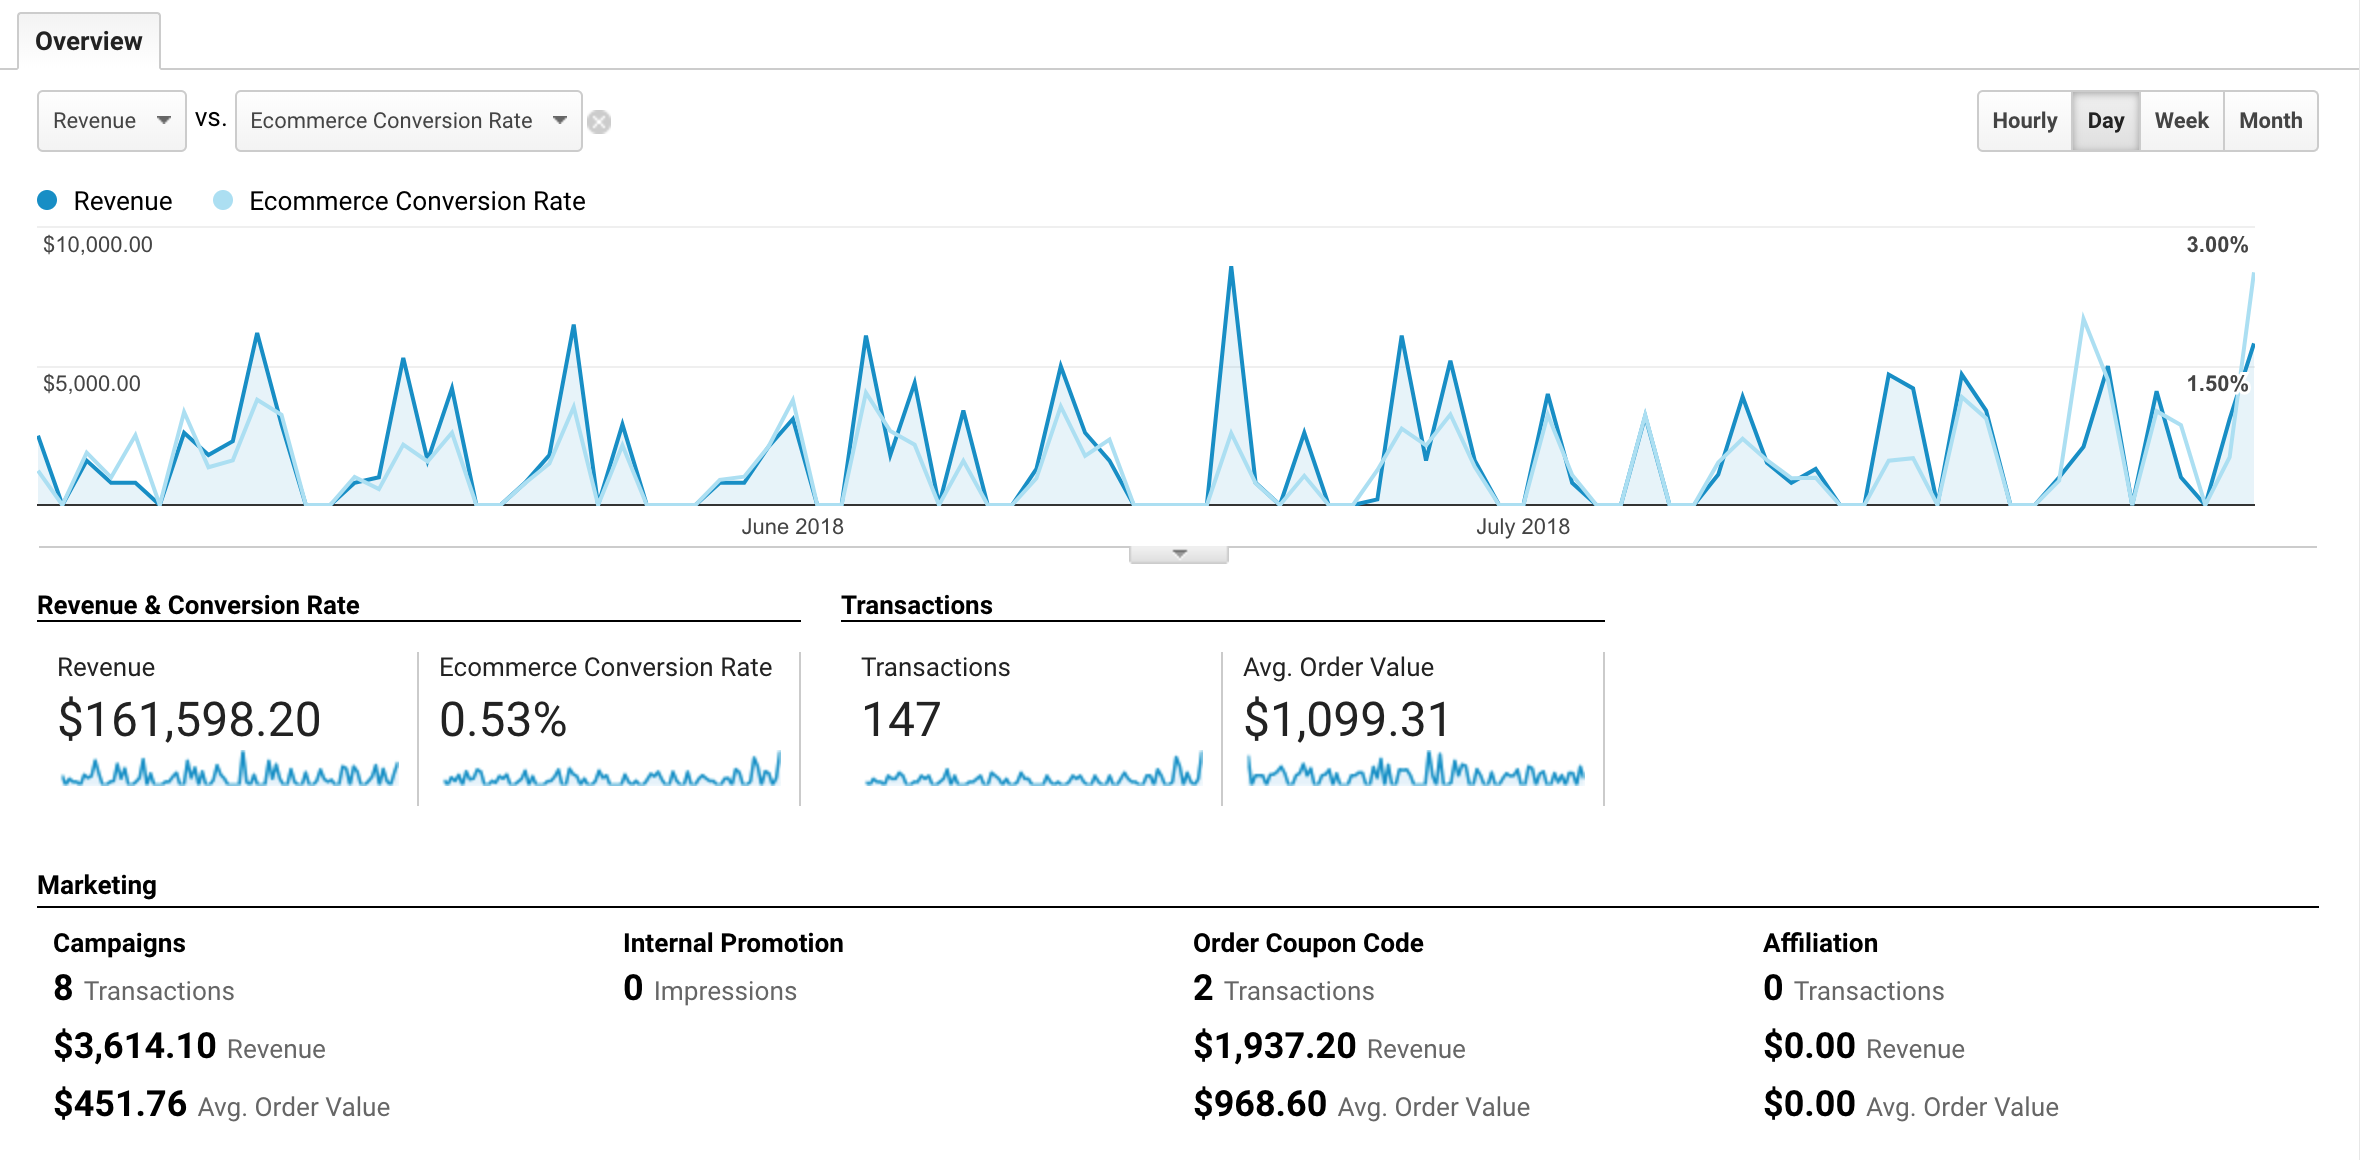
This is similar to the Dashboard view in Tito itself, but now the information has been pulled into Google Analytics, it’s easier to run custom reports using different dimensions.
There’s also a Marketing summary at the bottom of this view that gives you an overview of how your various activities are performing.
Assisted Conversions
Conversions > Multi-Channel Funnels > Assisted Conversions
I touched on assisted conversions in Part 1. Conversions will be credited to the last interaction the customer had with your website (unless you change your attribution model). But what about other interactions the customer had with your website?
Let’s imagine in our example above, Sandy had been the one to book the ticket instead of asking Chase to do it. The conversion would have been attributed to the marketing email, as that was the last interaction before they made the purchase. However, in this example Twitter and AdWords also played a role. So Google Analytics considers these channels an assist for that particular conversion. Here’s how that report looks:

Often, when you drill down to this level, you find that seemingly less effective marketing activities actually help coax people down the path towards a conversion.
Top Conversion Paths
Conversions > Multi-Channel Funnels > Top Conversion Paths
The best data is actionable, and sadly a lot of these reports fall more into the category of interesting. This is one such report:
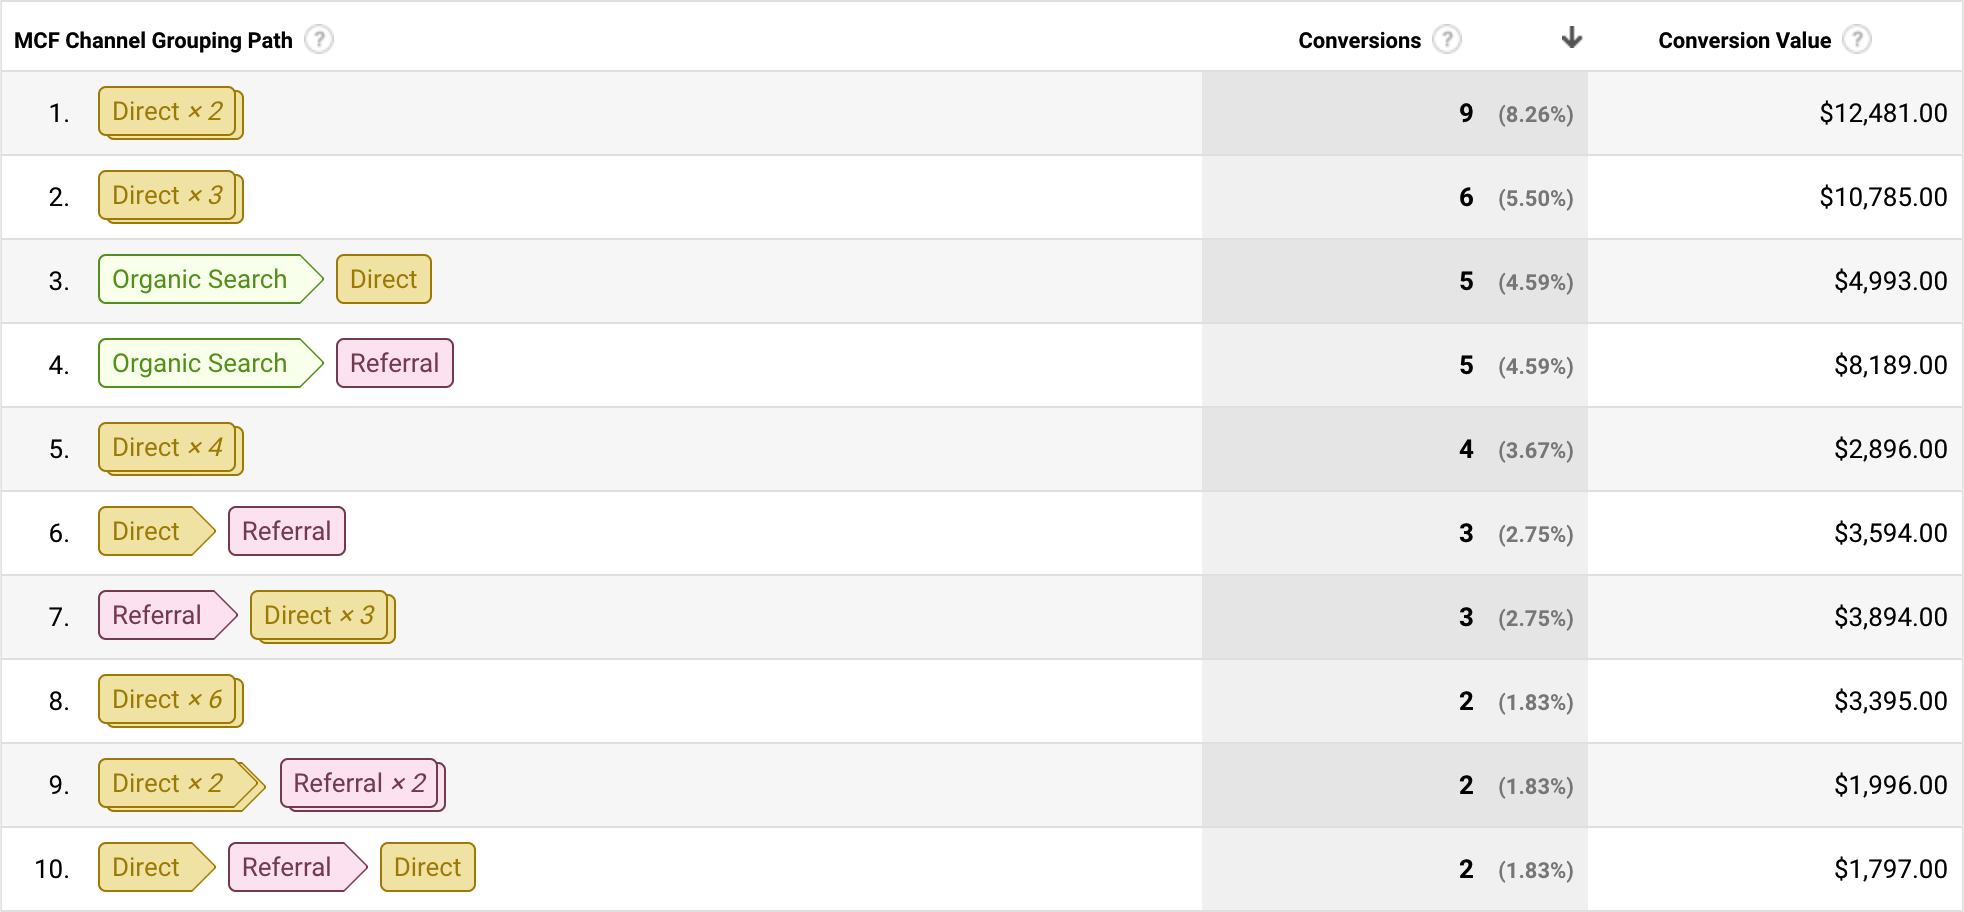
In our example in Part 1, Chase visited the event site directly twice. Once when Sandy sent the first email, and then again when Sandy sent the reminder. On the second visit, Chase bought a ticket. According to the report above, this behaviour is pretty typical (eight other conversions followed the same path).
However, we know that it doesn’t paint a complete picture, because Chase was booking on behalf of someone else. If anything, the Top Conversion Path report serves as a reminder of just how many different path combinations your customers may take before finally booking a ticket.
For reference, here’s a summary of what each of the channel types mean.
Multi-Channel Funnels Overview
Conversions > Multi-Channel Funnels > Overview
The final report I want to show you is another fascinating if not particularly useful one. The Multi-Channel Conversion Visualizer shows you a Venn diagram of the different channel combinations that led to conversions.
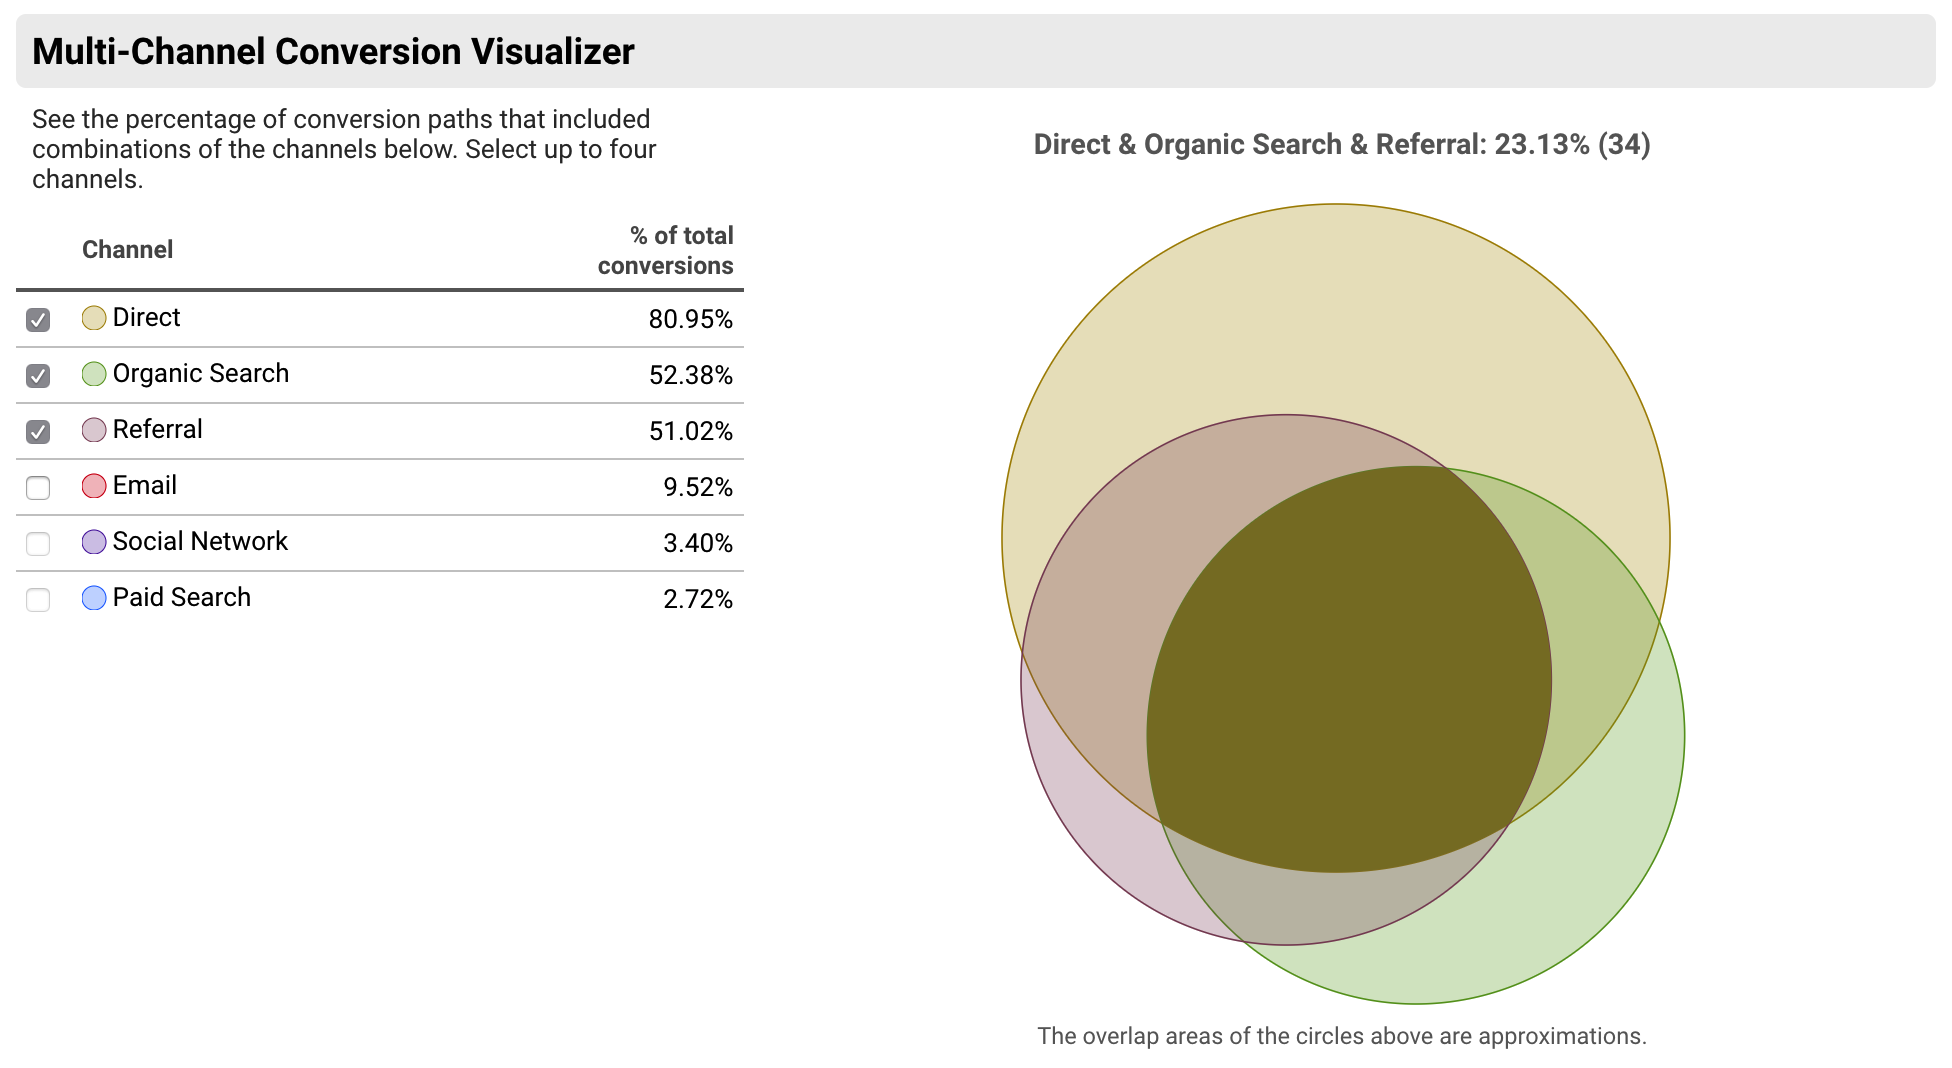
For visual people, this is an easier format to digest than raw numbers, and can be used to jazz up dull looking internal marketing reports, if nothing else. ?
Summary: Is Google Analytics Worth It?
Data needs to be actionable for it to be worth anything, and my personal feeling about Google Analytics is that the stats can be fascinating, but you can sometimes also find yourself heading down a rabbit hole with not a lot to show for it. You need to remain mindful of the limitations.
Organiser Pro Tip: If you report to stakeholders who value data above all else, make sure they’re aware of the limitations too. It’s easy to think numbers are the answer to everything, because you can’t argue with numbers, but they need to understand the numbers might not be telling the full story.
Considering Google Analytics is a free tool and that it doesn’t take much time or effort to set up the integration with Tito, there’s no harm in having it to refer to. But set yourself clear goals of what you’re trying to measure, and avoid placing too much emphasis on vanity metrics like pageviews. Ultimately what matters is how many people register for the event!
But Google Analytics can yield some interesting clues about which campaigns or sources are working hardest for you, and often the data can surprise you and challenge your assumptions. It’s always a good idea to try new things, record what happens, and then iterate.
In a future post I’ll drill into some specific event marketing strategies I’ve had success with in the past. In the meantime, I’d be really interested to hear your Google Analytics success (or failure) stories, or your thoughts on this post. Drop me an email.